Data work that finally feels effortless
Easily clean, manipulate, explore and visualize your data. Built by data people, for data people.
Start in seconds. No email or card required
Made for your workflow
For data analysts, scientists, and engineers. Move from raw data to clear insights, with visual tools, SQL, and intelligence working together.



Data Cleaning
Clean data without the hassle
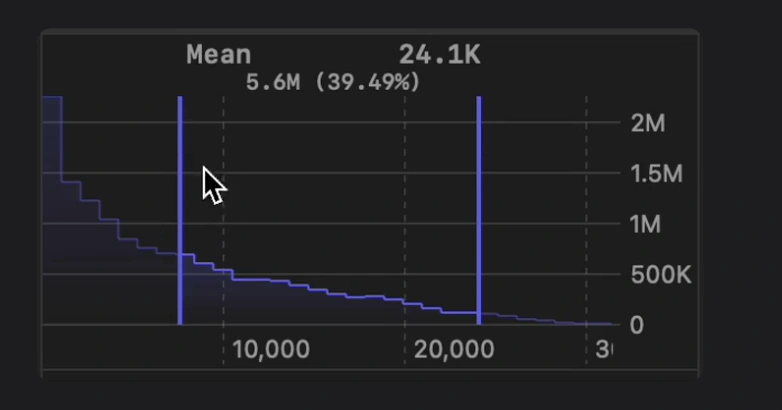
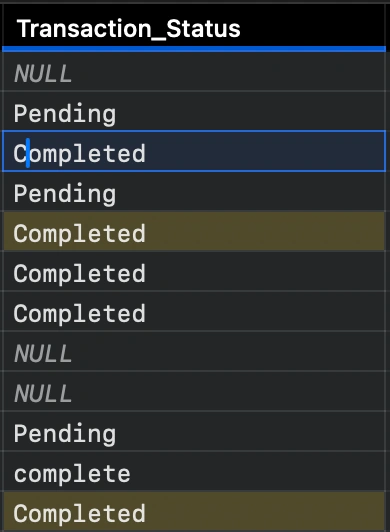
Make the most important part of any analysis effortless. Quickly spot issues, filter data, reconcile values, rename, or anything else your need.

Local, remote or both

Continue with custom SQL

Bring datasets together

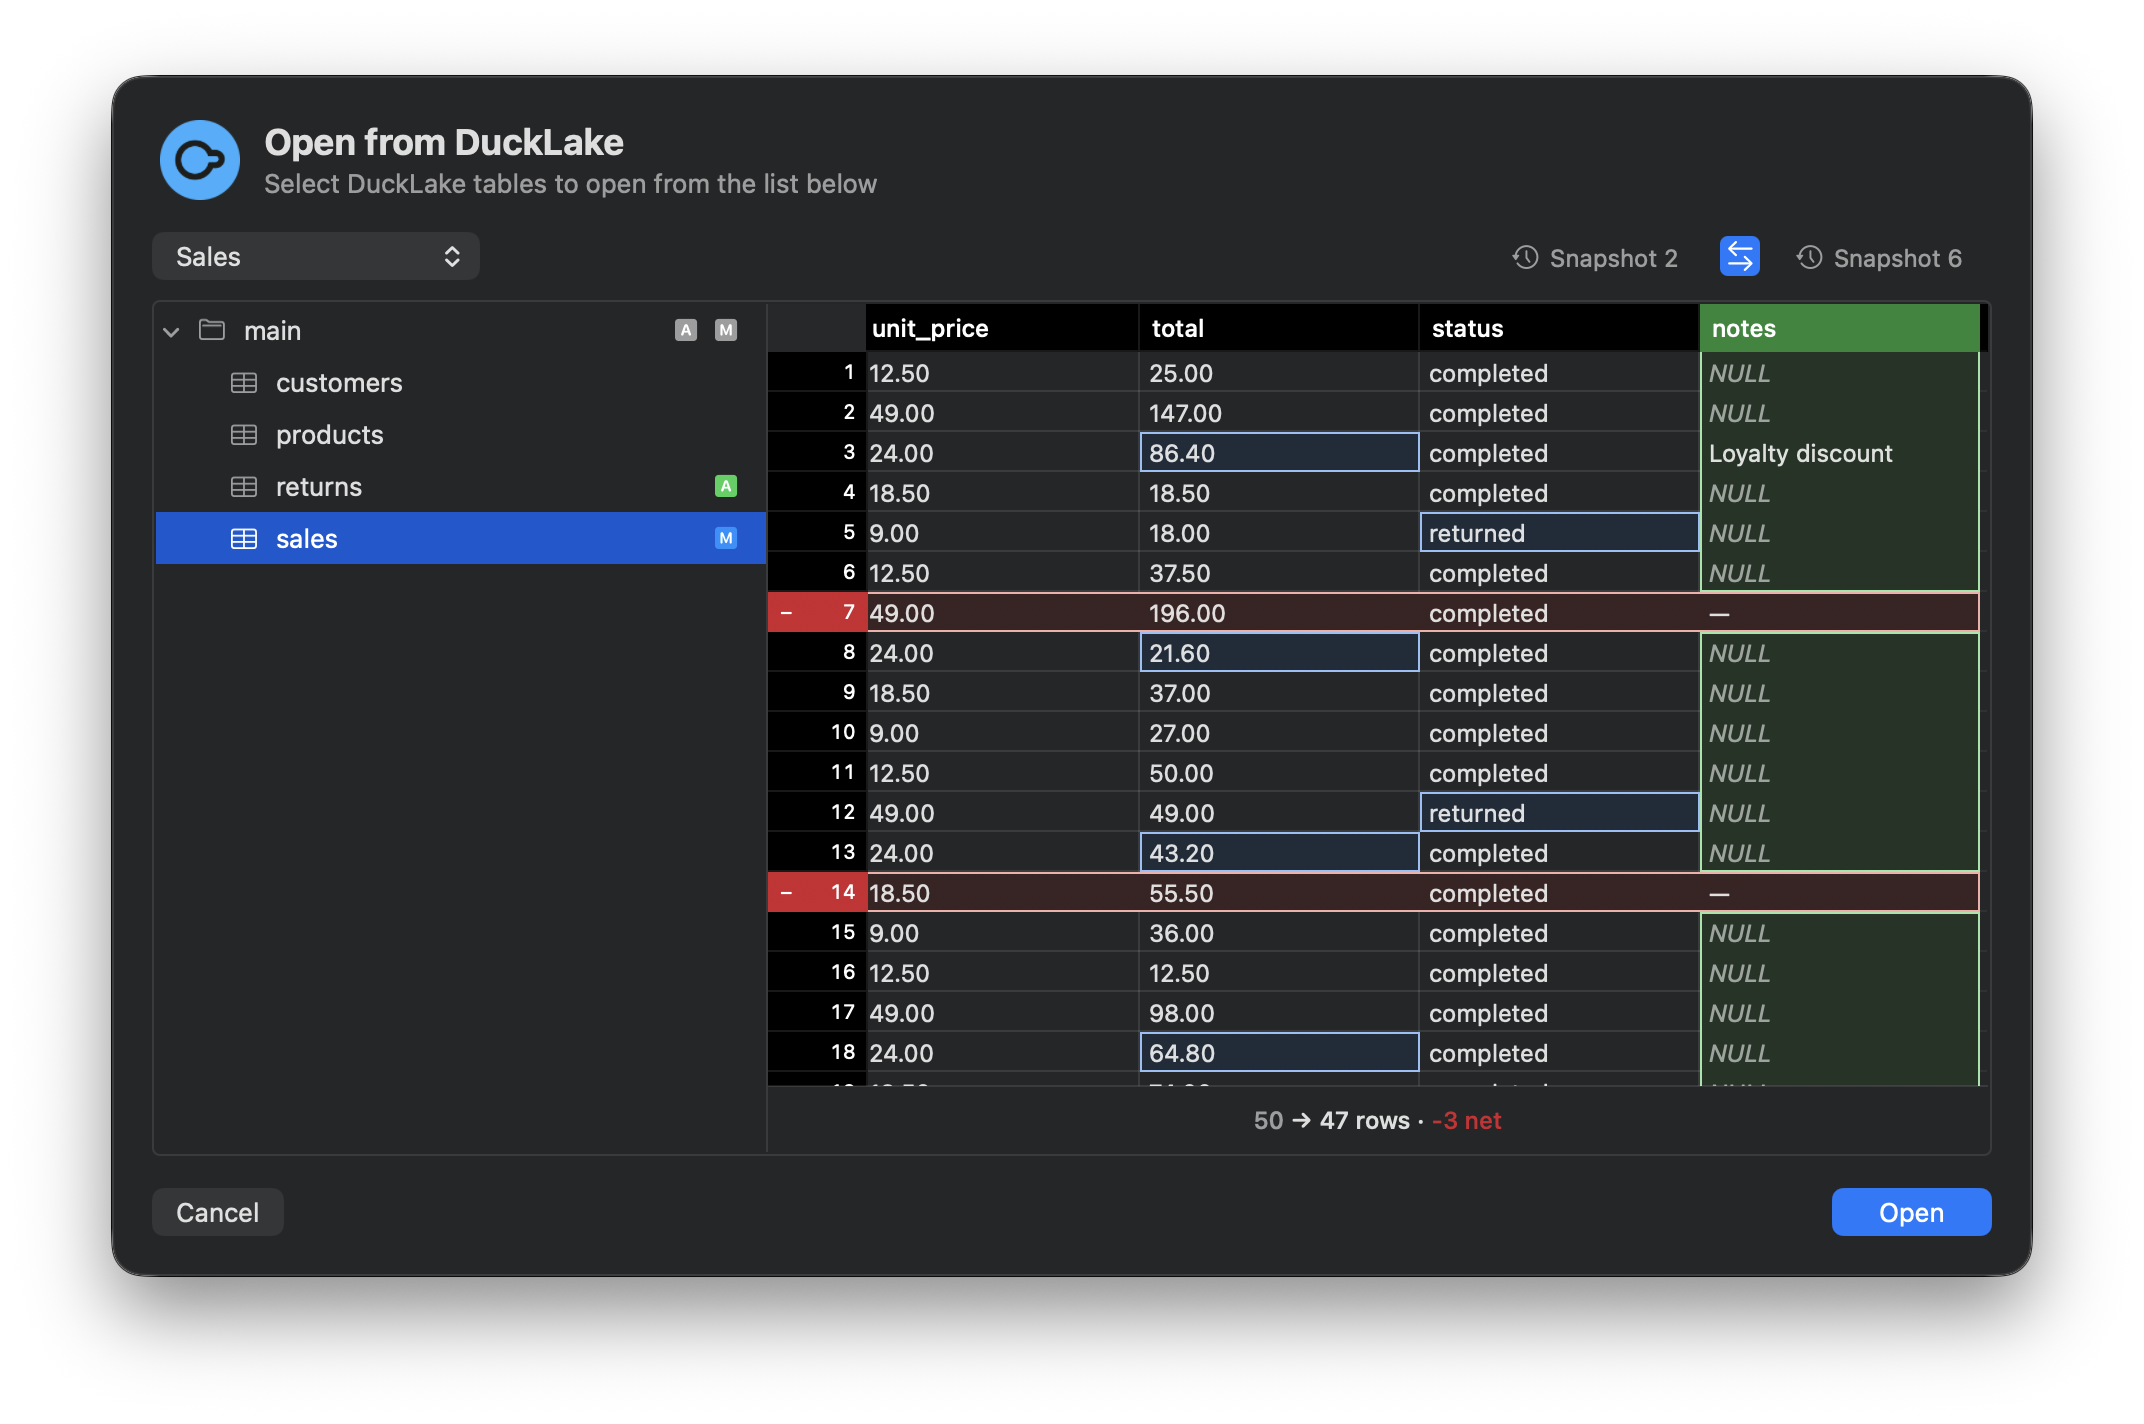
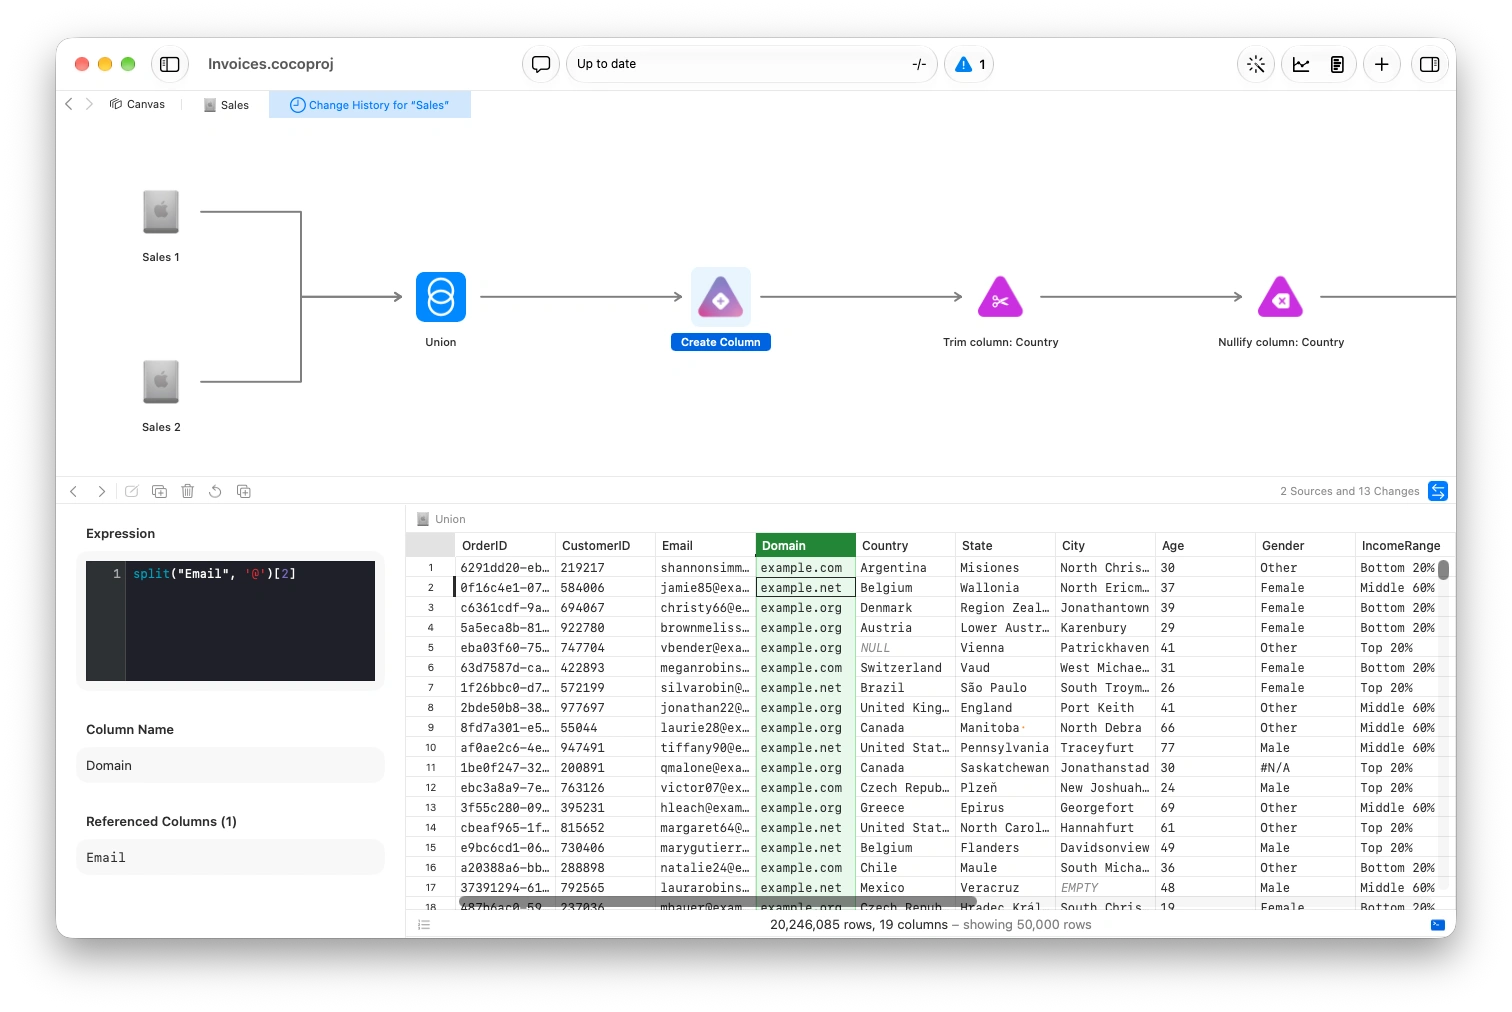
Backtrack, anytime
Track changes automatically
Visualizations
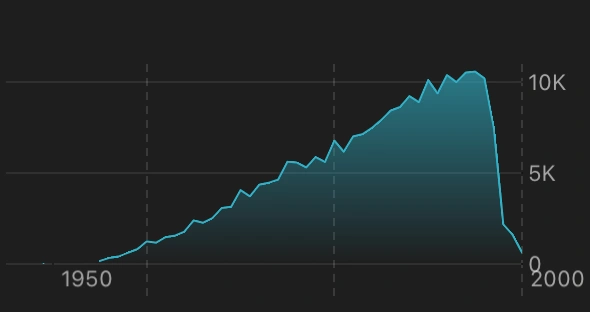
Make charts that impress
Build interactive charts without code. Customize colors, fonts, and layouts to make them yours. Use a familiar BI-style interface with extensive customizations, and blazing fast performance.
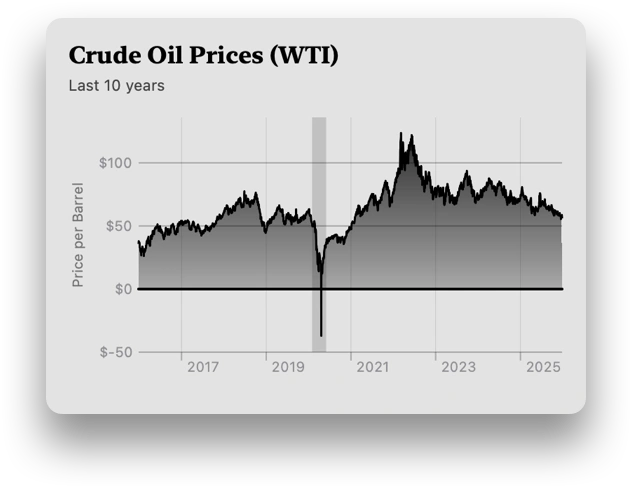
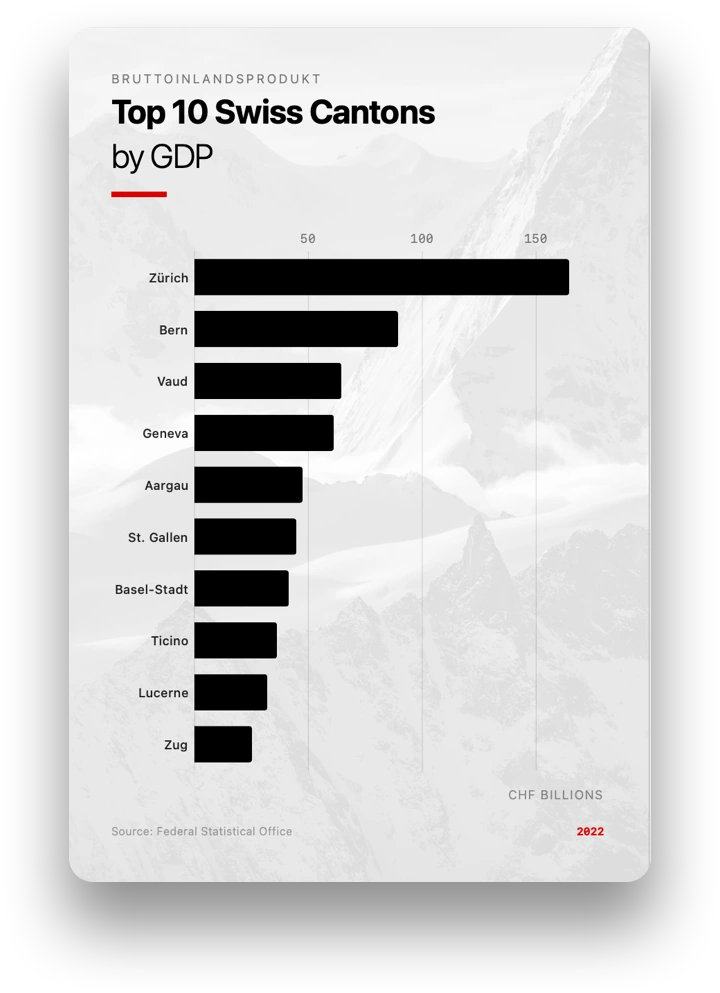
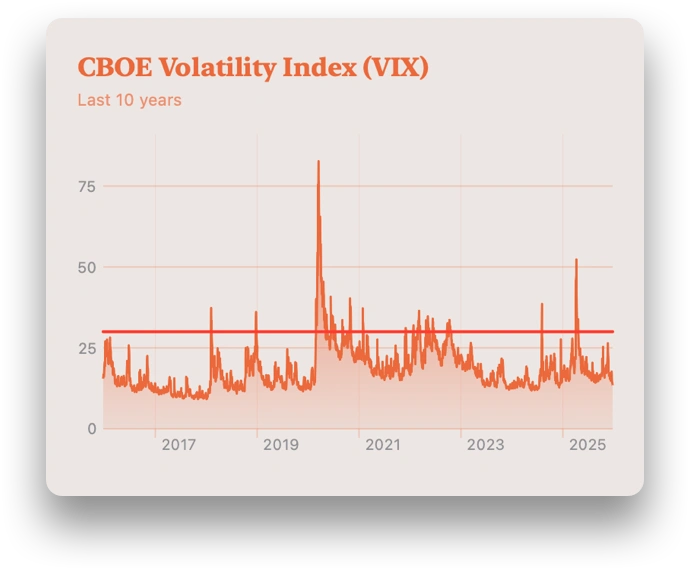
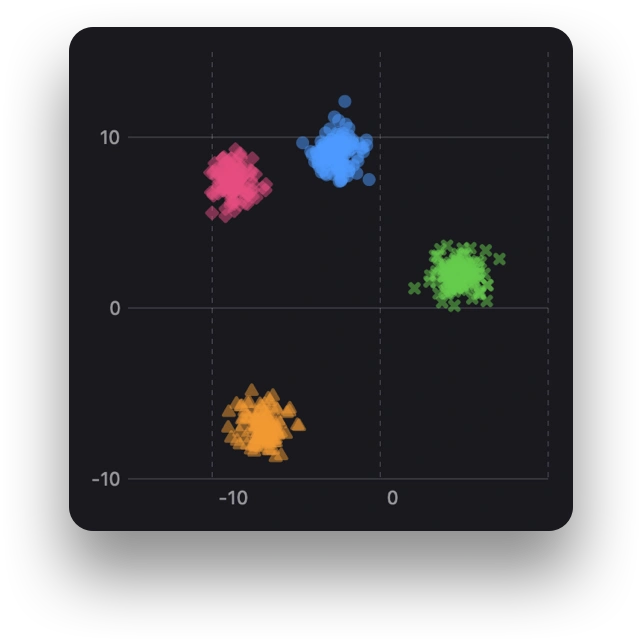
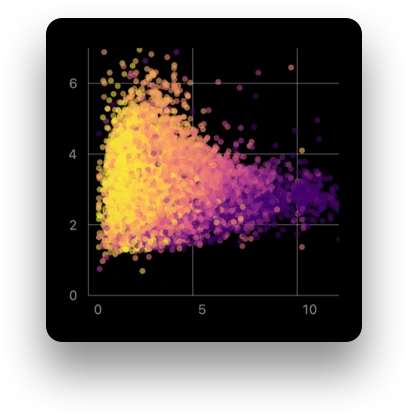

Customizable Colors

Extensive Fonts

Flexible Layout

Embeddable Images
Intelligence
Agentic assistance, without the gimmicks.
Describe what you want to see, clean, understand, edit, or visualize. Coco knows your data, gets to work, and gets out of your way.

Create and edit visualizations
Describe the chart you want, then ask Coco to refine its colors, labels, and layout. Keep shaping it with your own edits.

Clean data with a simple request
Ask Coco to standardize inconsistent values, tidy up categories, or filter your data. Review the changes as part of your workflow.

Find issues and work through them
Ask Coco to investigate unexpected values or results, use your change history for context, and help you resolve the underlying issue.

Your data stays private
Your conversations are never stored or used to train models. Only the relevant data needed to complete your request is sent for processing.